Advertisement
If you've ever worked with large volumes of information and felt like everything was scattered, a data warehouse might be the structured relief you’ve been missing. It's not some mysterious vault filled with blinking servers; it’s a thoughtful way of organizing data so it actually makes sense. And yes, it helps businesses make better decisions without needing to dig through a dozen messy spreadsheets. Let’s get into what a data warehouse really is, why it’s useful, and how its structure holds everything together without falling apart.
A data warehouse is a centralized system that collects and organizes information from various sources, but its real purpose goes beyond storage—it's built for analysis. While everyday databases handle routine tasks like tracking user activity or processing orders, data warehouses focus on long-term patterns and summaries to support decision-making.
Imagine a regular database as your daily planner, and the data warehouse as your five-year journal. It's about the bigger picture—helping teams quickly answer questions like which product performed best over the year. It also standardizes messy data, turning inconsistent formats into clean, usable information that makes reporting accurate and reliable.
Let’s walk through what makes up a data warehouse—not in theory, but in plain, practical terms.
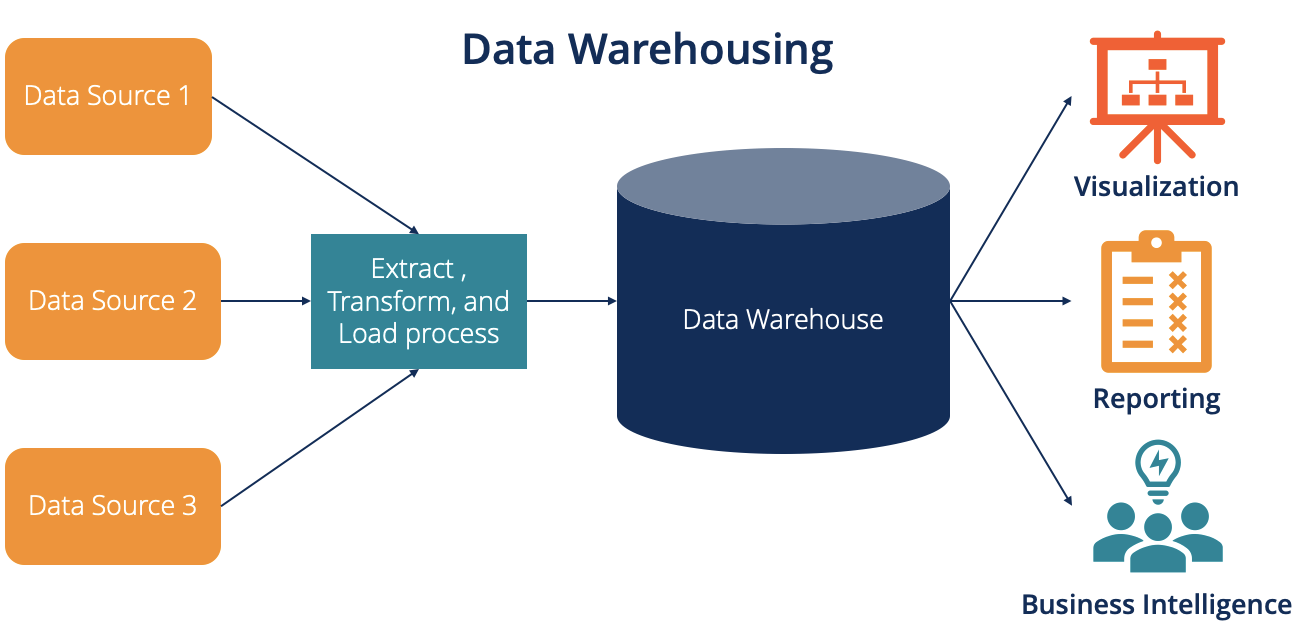
These are where the data comes from—customer service logs, sales databases, marketing platforms, and more. Each of these might store information differently, which is why the warehouse needs to organize and align them.
The key here is that the warehouse doesn’t replace these systems. It just gathers their data. The original sources still do what they were built to do, whether that’s managing inventory or handling user signups.
This is the quiet, behind-the-scenes process that gets data from those scattered systems into the warehouse. Here's what happens:
What's nice is that once this setup is in place, it runs automatically. That means users always have fresh, clean data at their fingertips, without needing to know how it got there.
This is where the data actually lives. But the structure is a bit different from your typical spreadsheet or transactional database. Data is grouped in ways that make it easier to analyze. One popular setup is called the star schema, which we'll talk about in a moment.
The storage layer is optimized for reading, not writing. That means it’s built to pull answers quickly rather than constantly update with every new sale or click.
Here’s where it all comes together. This is what analysts, executives, and curious team members actually see. The presentation layer delivers dashboards, reports, and charts using tools like Tableau, Power BI, or Looker.
Users don’t need to know where the data came from. They just ask a question—like "What was our top-selling item in June?"—and get a reliable answer within seconds.
The structure of a data warehouse sounds more intimidating than it is. It’s built for clarity, not confusion. Let’s look at the two main ways it organizes data.
This is the most common layout—and for good reason. It’s simple, intuitive, and efficient.
Imagine a star. At the center is the fact table. This holds measurable data, like sales totals or quantities sold. Then, surrounding it are dimension tables, which contain descriptive details, like dates, product names, or store locations.
So if the fact table says 10 items were sold for $200, the dimension tables explain when, where, and what those items were.
The beauty of the star schema is that it's easy to follow. Anyone familiar with basic tables can understand it at a glance.
This one’s a bit more detailed. It takes the dimension tables and breaks them down further. So instead of having a “product” table with everything in it, you might separate out “product category” or “brand.”
This setup saves space and helps with consistency, but it can be a bit more complex to navigate. Still, for larger datasets with lots of details, it's a helpful option.
If you're thinking of building one—or just want to understand how it's set up—here's a basic flow of how it happens.
Before anything else, you need to know where the data is coming from. List out all systems that hold valuable information—whether that’s sales platforms, email tools, or finance software.
You don’t need to bring in everything. Start with the metrics that matter—like revenue, customer retention, or product performance. That focus keeps things manageable.
This is where data starts flowing. Use tools like Apache NiFi, Talend, or cloud services like AWS Glue to automate the extract-transform-load steps.
Most start with a star schema. It’s straightforward and covers most reporting needs. Once you grow or need more detail, consider adding snowflake structures.
Before anyone uses it, check that the data is accurate. Run sample reports and compare them with known results. That extra check can save you headaches later.
Finally, hook up tools like Power BI, Looker, or whatever your team prefers. That’s when the warehouse moves from being a backend system to a practical tool for decision-making.
A data warehouse might seem like a big technical leap, but in practice, it's about organizing your information in a way that actually works. It brings everything together—no more scattered reports, no more duplicate data, no more guessing. With a clean structure, dependable processes, and the right setup, it becomes the silent workhorse behind your smartest decisions.
Advertisement

How to approach AI implementation in the workplace by prioritizing people. Learn how to build trust, reduce uncertainty, and support workers through clear communication, training, and role transitions

Can AI really help a Formula One team build faster, smarter cars? With real-time data crunching, simulation, and design automation, teams are transforming racing—long before the track lights go green

Snowflake's acquisition of Neeva boosts enterprise AI with secure generative AI platforms and advanced data interaction tools

AI-first devices are reshaping how people interact with technology, moving beyond screens and apps to natural, intelligent experiences. Discover how these innovations could one day rival the iPhone by blending convenience, emotion, and AI-driven understanding into everyday life

Discover the best AI art generator tools available today. Learn how you can create AI art from text prompts using powerful, easy-to-use platforms suited for beginners and pros alike

Struggling to connect tables in SQL queries? Learn how the ON clause works with JOINs to accurately match and relate your data

Learn the difference between SSH and Telnet in cyber security. This article explains how these two protocols work, their security implications, and why SSH is preferred today

How MPT-7B and MPT-30B from MosaicML are pushing the boundaries of open-source LLM technology. Learn about their architecture, use cases, and why these models are setting a new standard for accessible AI

How IonQ advances AI capabilities with quantum-enhanced applications, combining stable trapped-ion technology and machine learning to solve complex real-world problems efficiently
Learn how integrating feature selection into model estimation improves accuracy, reduces noise, and boosts efficiency in ML

How can vision-language models learn to respond more like people want? Discover how TRL uses human preferences, reward models, and PPO to align VLM outputs with what actually feels helpful

Google risks losing Samsung to Bing if it fails to enhance AI-powered mobile search and deliver smarter, better, faster results